CameoAir Environmental IoT Air Pollution AI Analysis Platform
- Tracking and controlling cross-regional air pollution all over Taiwan.
- We are capable of analyzing environmental sensing data by time and space, to the scale of minutes and streets/blocks.
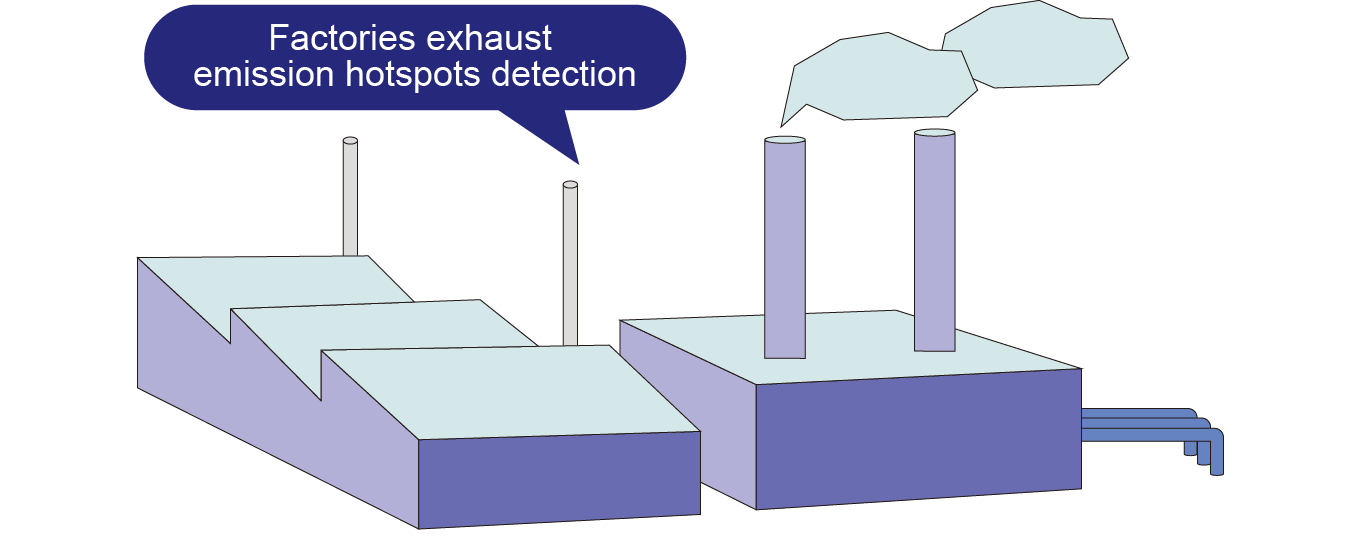
- Our solution covers three different aspects - (1) pollutant source detecting, (2) potential area monitoring, and (3) inspection planning.
IoT integrated management of cloud
CAMEO InfoTech Inc.
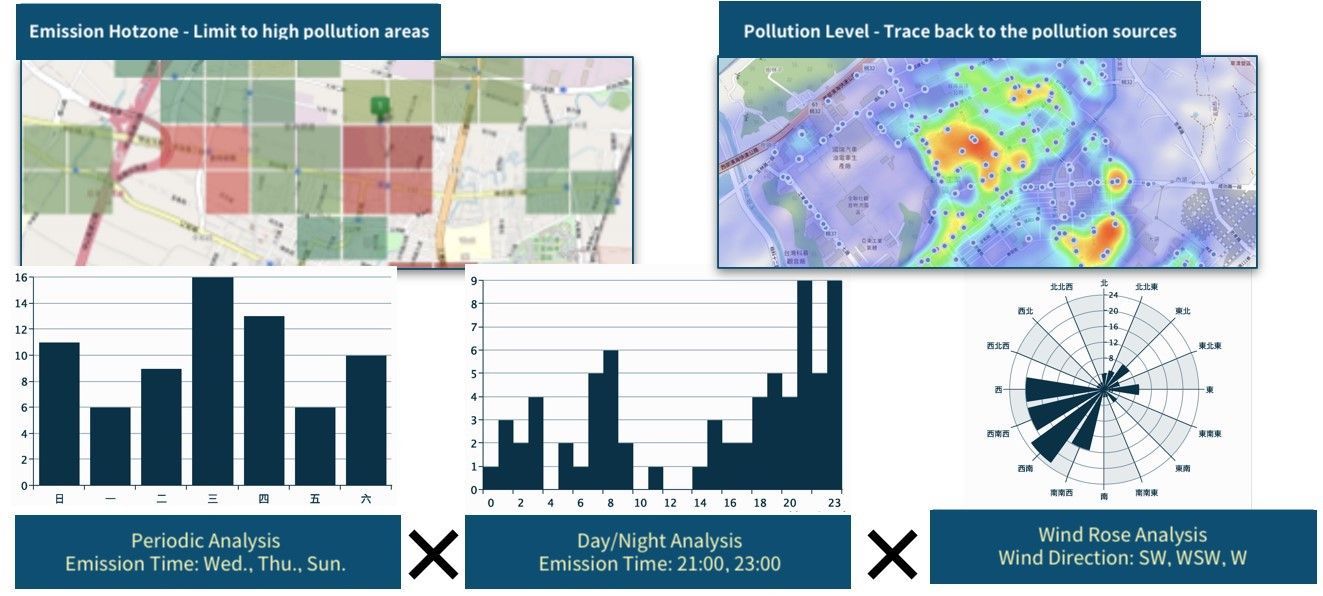
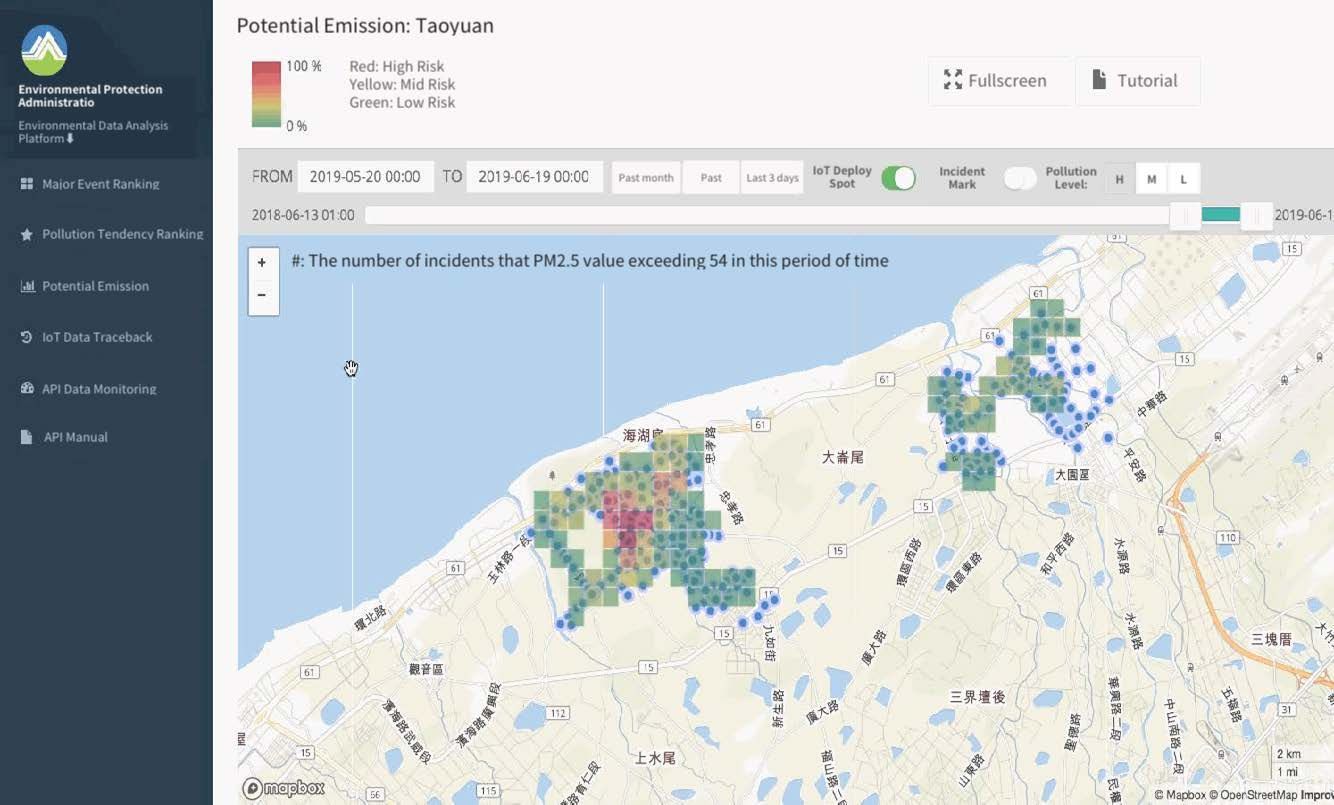
- With the Emission Hotspot & Pollution Heatmap, the suspicious area can be narrowed down in order to achieve the greatest audit efficiency.
- The Pollution Analysis is able to find out the peak hour and the potential area of the emission in order to assist the audit.
- With one click, narrowing down the list of the suspicious factories to save time and steps for the users.
- The animation will be auto generated and the push notification will be sent right after the pollution is detected. The situation of pollution can be tracked instantly.
- Providing the ranking for the major events and the pollution trend.
- Providing the hot area analysis for the potential trend.
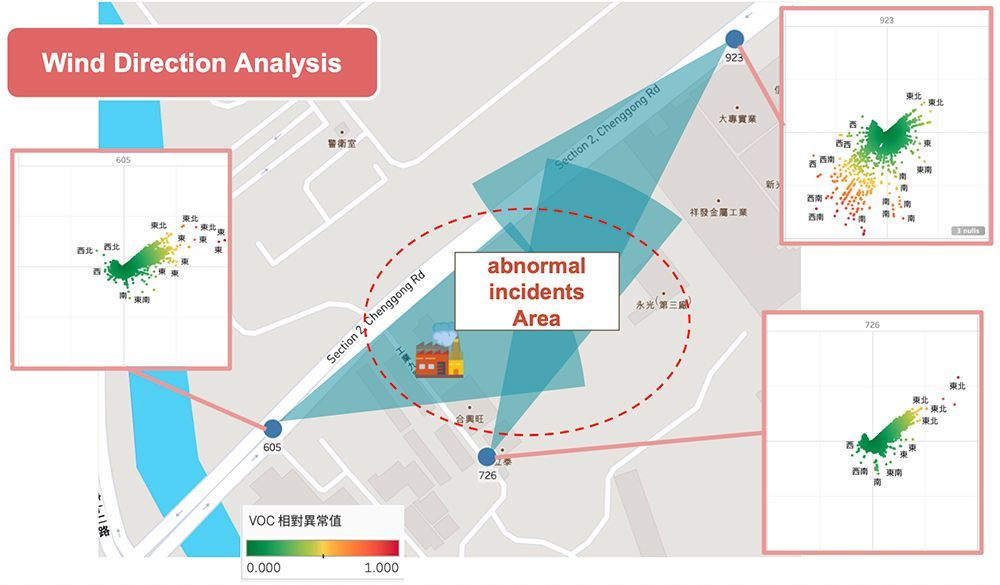
- Backtracking the suspicious emission 24/7 so the irregular situation can be detected immediately.
- Assisting the Environmental Protection Administration to audit suspicious factories with the detected data and AI analysis. The total fine issued is approximately 220 million NTD.
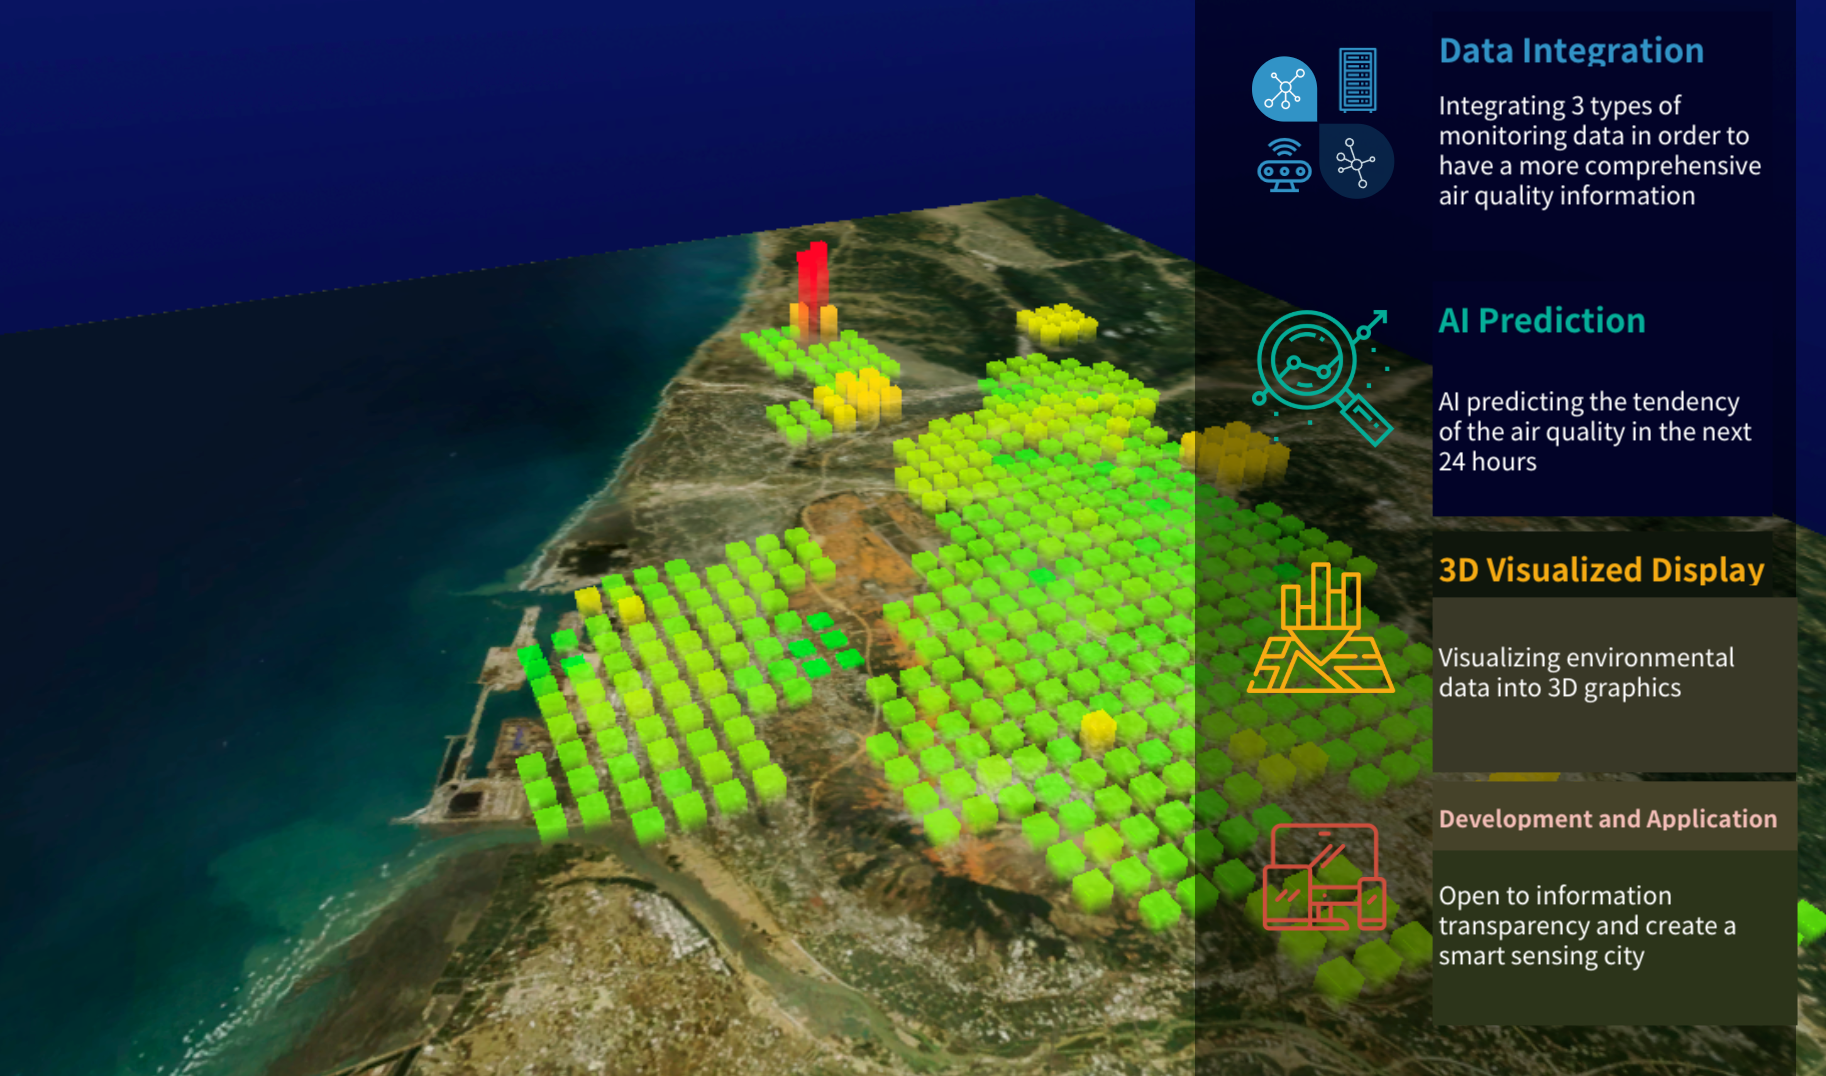
- PM2.5 IoT data HotSpot index Visualisation
- PM2.5 Spatial Time Series Detection Module
- Suspicious pollution source identification (Heatmap)
- Real-time Streaming Message Queue Process Mechanism
- Spatial Time Data Trace-Back and Map Animation Module
- Containerization Flexible Management Framework

